 I’m using Ivan Morris’ translation of Saikaku’s The Life of an Amorous Woman and other Writings this semester1, but one thing which is bugging me right off the bat is his habit of translating money into Pounds Sterling by converting the Tokugawa money to rice and then converting the rice to yen and the Yen to Pounds at the 1963 rate.2 Needless to say, neither I nor my students have any intutitive sense how much £16.70 in 1963 is worth today, but that’s what he says one gold Ryo is. According to the first historical currency calculator I could find, that’s about US$335.24 now. But that’s assuming that the original gold-rice/rice-yen calculation is worth anything….
I’d much rather have had a discussion about relative purchasing power, but here’s my best (quick) guess:
A little more digging and I found How Much Is That? which covers a good swath of modern financial history with converters that are a bit more open about their indices. The What Were Japanese GDP, CPI, Wage, or Population Then? page is set up to produce “Annual Observations in Table and Graphical Format for years 1879 to Present” based on your inputs. Unfortunately, the data actually only goes back to 1952, except for the CPI.3 Still, plugging in the 1963 Yen values Morris uses and you get4
| Tokugawa | 1963 ¥ | Current ¥ | Current dollars5 |
| 1 gold ryo | 16,350 | 67000 | 742 |
| 1 Ichibu-koban | 4,087.5 | 17000 | 181 |
| 1 silver chogin | 11717.5 | 47300 | 525 |
| 1 silver kamme | 272,500 | 1,100,000 | 12,180 |
| 1 copper kanmon | 4,087.5 | 17000 | 181 |
| 1 copper monsen6 | 4.1 | 17 | .18 |
This is still not terribly satisfying, since it’s based on continuity in rice prices — and if I wanted to be really thorough, I’d convert the 1963 yen value back to rice, then convert rice to yen for current prices.
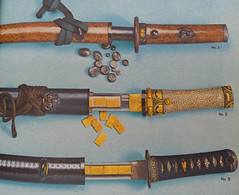
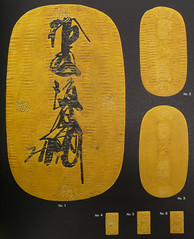
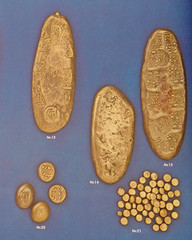
Then there’s specie value by weight, just for kicks. Using Morris’ weights:
| Tokugawa Coin | weight in momme7 | weight in grams | Current market value in dollars |
| 1 gold ryo | 4.8 | 18 | 512.45 |
| 1 Ichibu-koban | 1.2 | 4.5 | 128.11 |
| 1 silver chogin | 43 | 161.6 | 61.72 |
| 1 silver kamme | 1000 | 3758 | 1435.37 |
| 1 copper kanmon | 1000 | 3758 | 12.34 |
| 1 copper monsen | 1 | 3.758 | 0.012345 |
As I said before, I much prefer a discussion of relative incomes and purchasing power. Fortunately, I just got the announcement of the new EMJ, including Constantine Vaporis, Samurai and the World of Goods: the Diaries of the Toyama Family of Hachinohe. So I have some fresh scholarship I can share along with the old.
Appendix II, “Money in Saikaku’s Time” ↩
I’m very surprised: population and GDP data for those years isn’t exactly hard to find…. The Historical Statistics of Japan has some data going back to the late 19c and early 20c. Not the most interesting stuff, but at least some of the basics. The Bank of Japan statistics covers some of the early 20c in detail. HistoricalStatistics.org is a Swedish site with some interesting stuff on it, like the excel spreadsheet with population and GDP estimates for the whole world going back to year 1! ↩
I’m going to use an approximation for current yen values, based on CPI and Real GDP per capita. Nominal GDP numbers seem very high…. ↩
Using the current 90/dollar ↩
There’s an error in Morris’s table, I think: he indicates the yen value of the kanmon as being 100,000 times greater than the monsen instead of 1000 times. Since, according to Morris, the kanmon should be equivalent to the ichibu-koban, I have to assume that the monsen needs to be scaled up. ↩
Morris pegs the momme at 58 troy grains, or 3.758 grams ↩