Do you teach about export-led growth in Asia? Like to talk about the process of oh, say China, gradually exporting increasing amounts of stuff to the U.S., and moving up the ladder from cheap labor intensive goods to more high-tech stuff?
Luckily, MIT can help you visualize this for your students.
Here are China’s exports to the US in 1969.
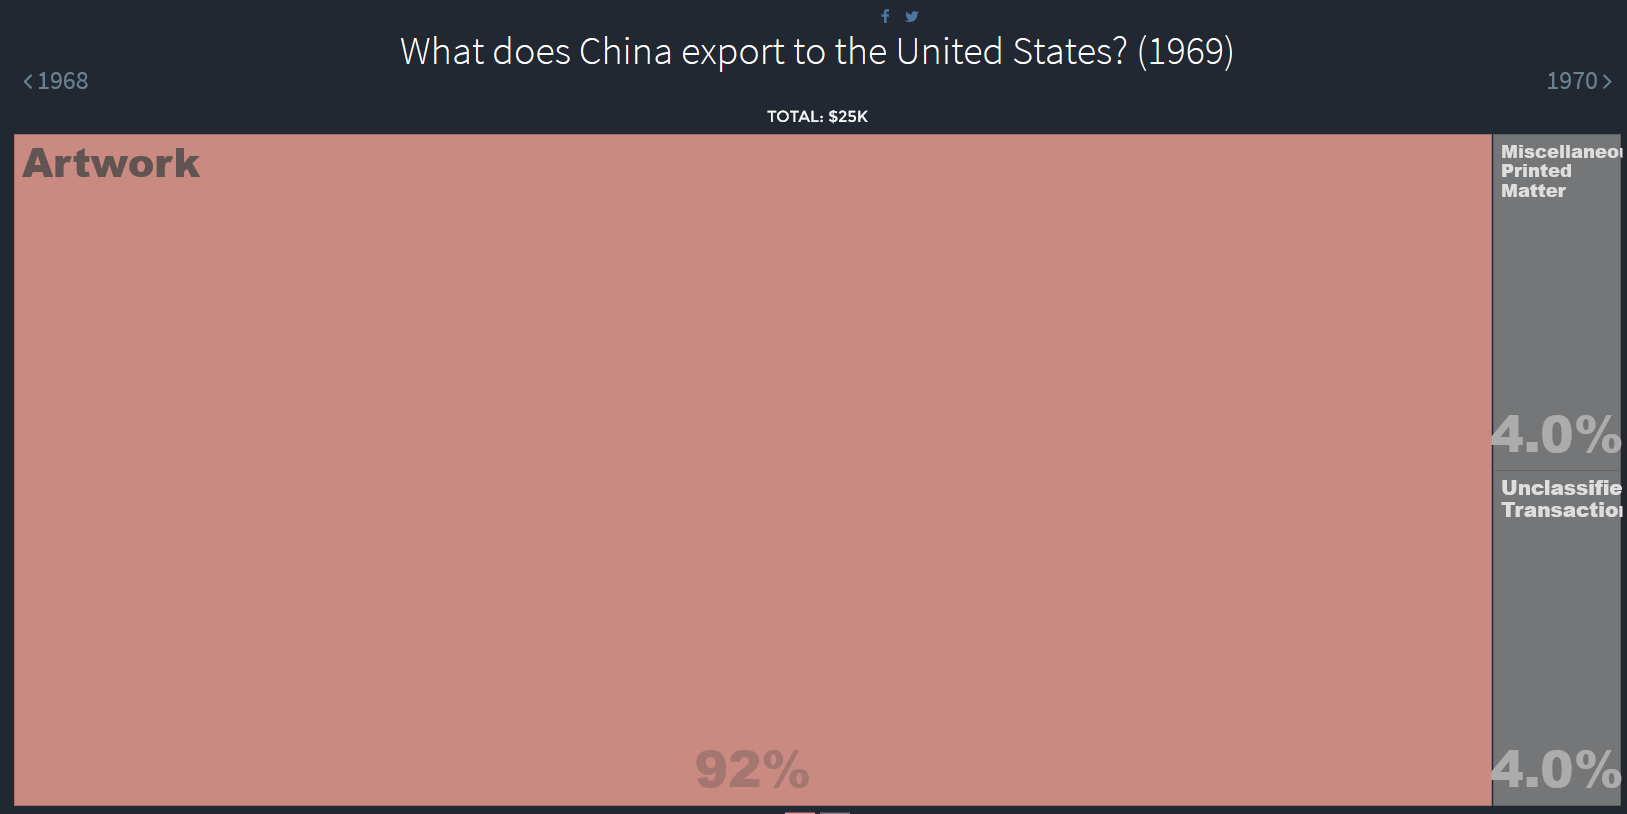
Not much, and most of that Mao posters, I guess. By 1976, the year Mao died, things have changed some.
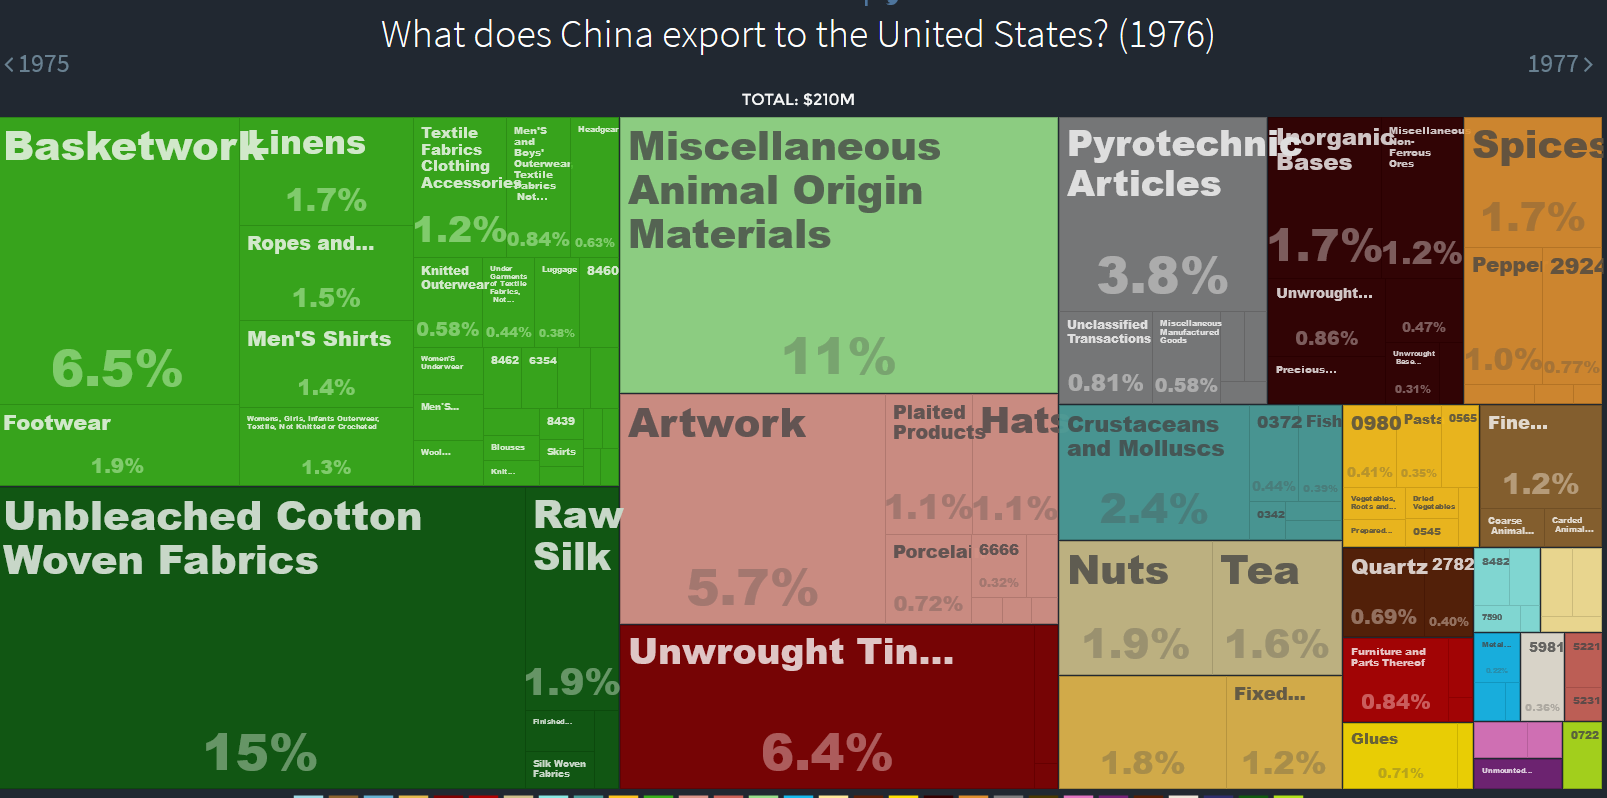
Art is still there, but unwrought tin, unbleached fabric and baskets have passed it. Still seems like a pretty low end collection of stuff. By 1983 the reforms have started.
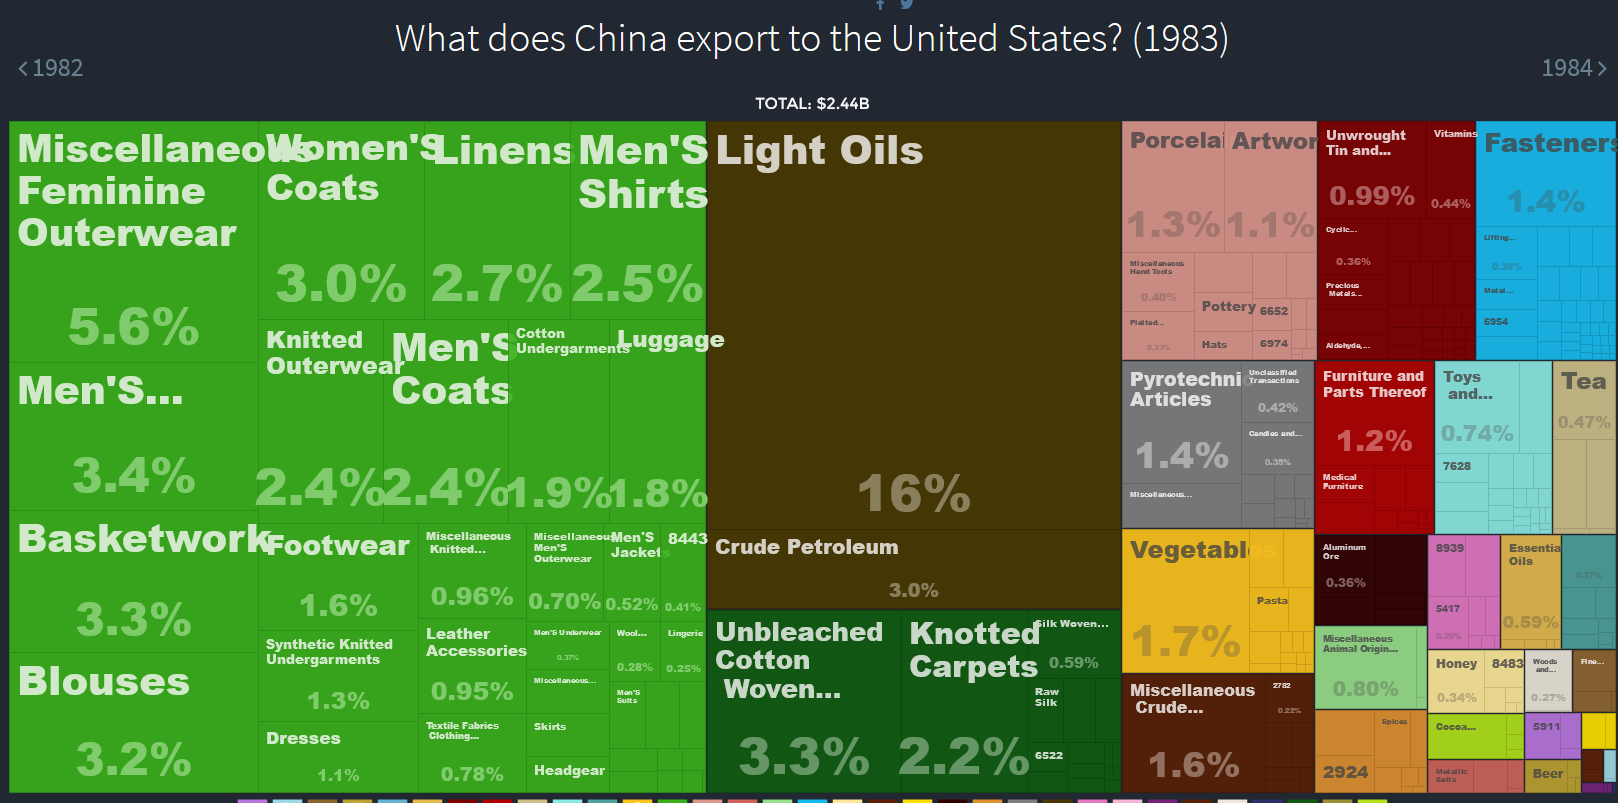
Light oils are on top, but lots of clothing as well. Take advantage of that cheap labor! By 1992, three years after nothing happened in China, we are well on our way.
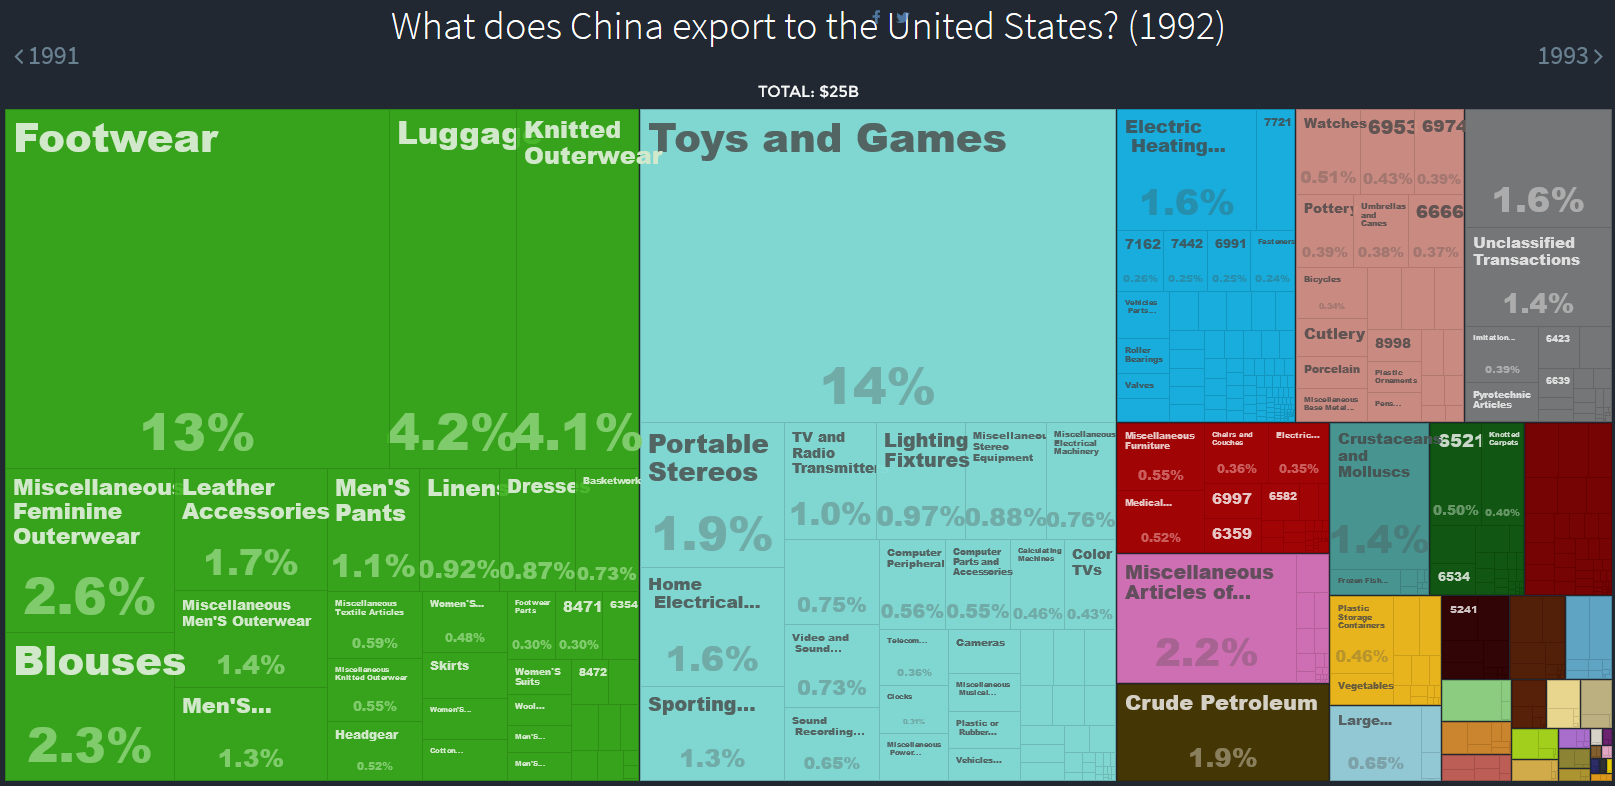
Lots of clothing, but also toys and consumer electronics. Also note that crude petroleum is still being exported. China produces it, but does not have enough cars to use it all up. Here is 2004.
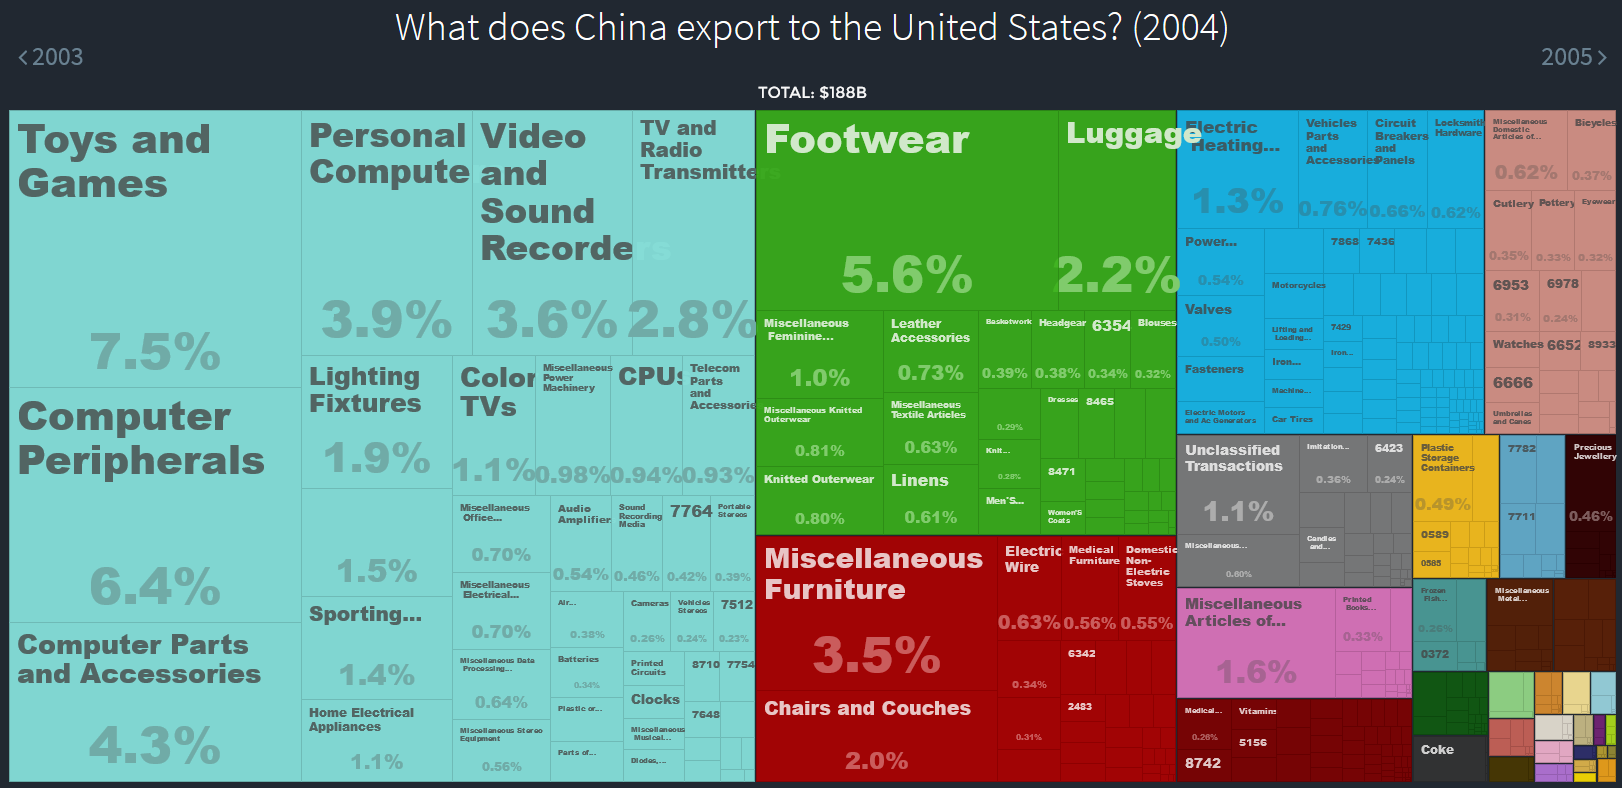
Electronics have taken over from clothes, and computer stuff surpasses games. Also lots of furniture and almost everything else. China really has become the world’s factory. The last year they have data for is 2014.
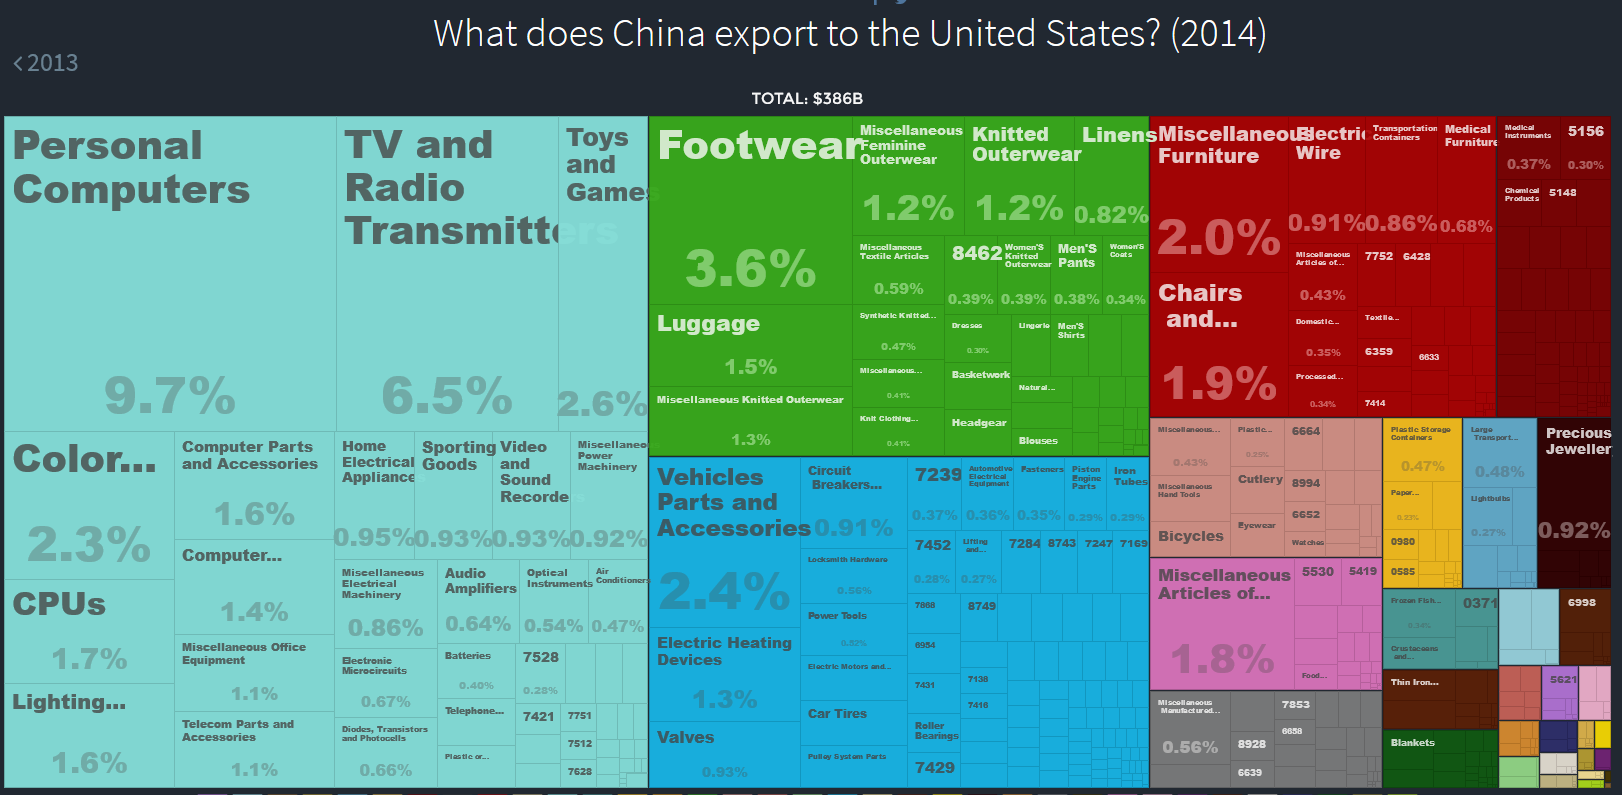
368 billion dollars of imports, and personal computers are the largest item. By comparison, here are US imports to China in 2014
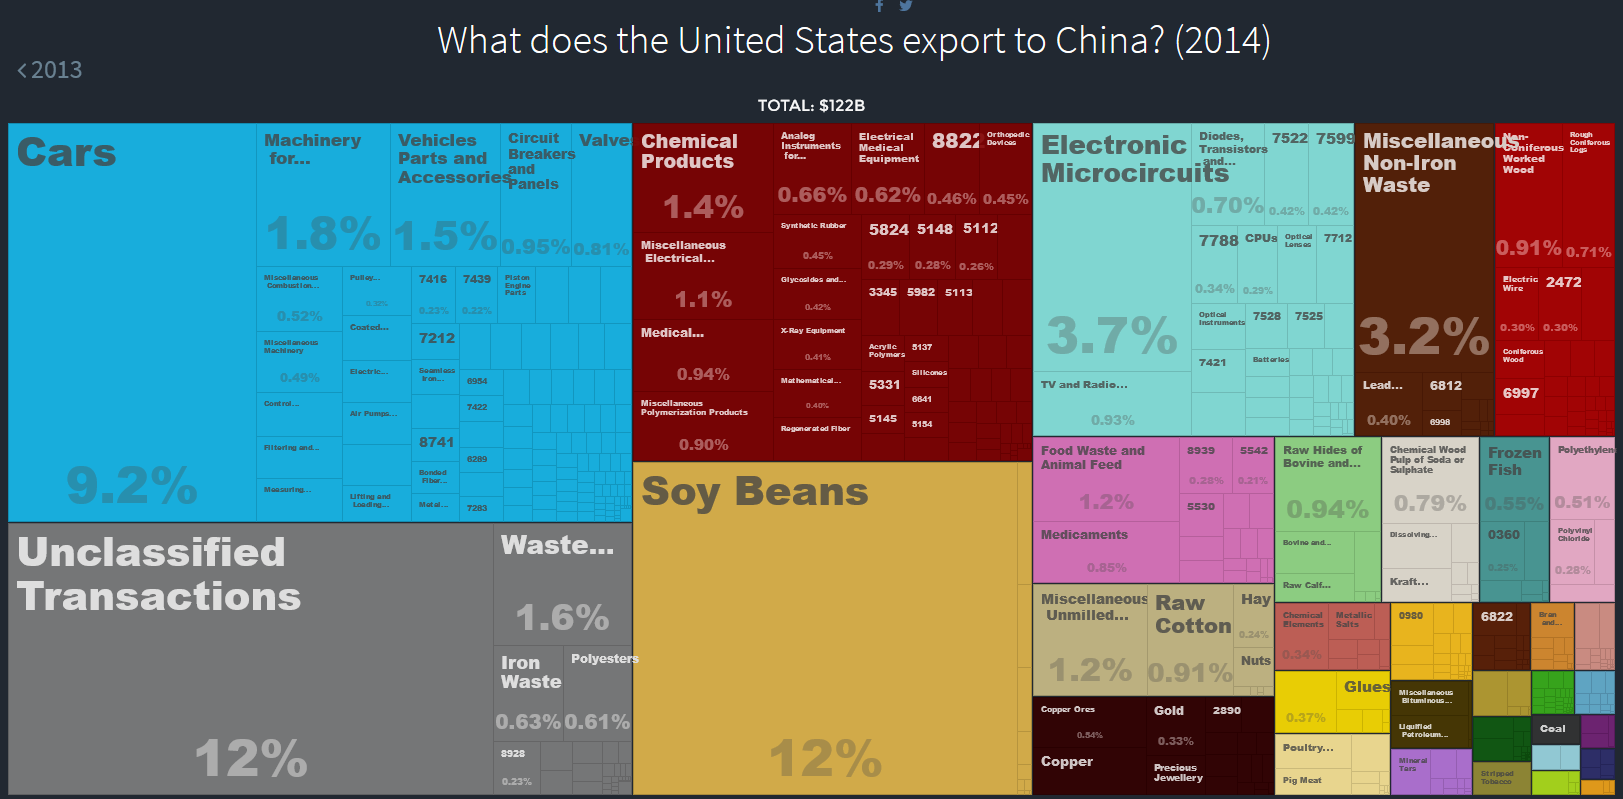
Soybeans and cars. That’s my U.S.A.!
Anyway, it is a fun tool and you can easily generate some good classroom stuff with it.
1 Comment